Results and Graphs
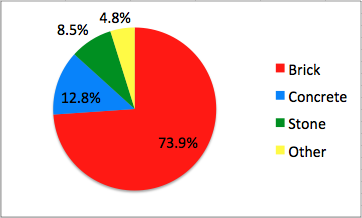
Building Materials
Materials and percentage of Employees Cornices and Canopies
Cornices and Canopies with % of Employees Age of the Downtown
The Age of the Downtown Relationship between the Age of the Buildings and the Number of Employees Graphs with interesting interrelations
Density of Employees (sq.m. per one empl.) depending on the total area of the building Mean number of employees depending on the total area of the building Another view of the Downtown
Classification of buildings by employee totals Classification of buildings by year of construction Classification of buildings by the presence of cornices Classification of buildings using Google Earth